

Museum visitors in Riverton (line graph)
You should spend about 20 minutes on this task. Write at least 150 words.
Teacher tips for this prompt
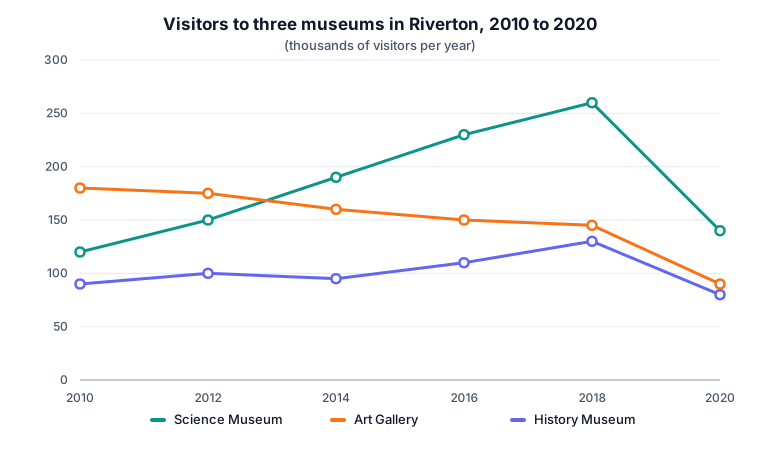
The line graph compares annual visitor numbers at three museums in Riverton over a ten-year period from 2010.
Overall, the Science Museum became by far the most visited attraction, while attendance at the Art Gallery declined steadily. All three museums experienced a sharp fall in visitors in the final year.
In 2010, the Art Gallery was the most popular museum, attracting around 180,000 visitors, compared with 120,000 for the Science Museum and just 90,000 for the History Museum. Over the following eight years, however, the Science Museum's figures more than doubled, peaking at roughly 260,000 in 2018. The History Museum also grew, albeit more modestly, reaching about 130,000 in the same year.
In contrast, the Art Gallery lost visitors throughout the period, slipping gradually to around 145,000 by 2018. In 2020, numbers dropped dramatically at all three venues: the Science Museum fell to 140,000, the History Museum to 80,000, and the Art Gallery to just 90,000, half its 2010 figure.
More Task 1: Academic report prompts
Changes to Saltmarsh village (maps)
The maps below show the village of Saltmarsh in 2005 and today. Summarise the information by selecting and reporting the main features, and make comparisons where relevant.
How people travel to work in four cities (table)
The table below shows the main ways people travelled to work in four cities in 2024. Summarise the information by selecting and reporting the main features, and make comparisons where relevant.
From jute plant to fabric (process)
The diagram below shows how jute fibre is turned into fabric. Summarise the information by selecting and reporting the main features.