

টাস্ক 1: একাডেমিক রিপোর্ট
Technology
তরুণরা অবসর সময় কীভাবে কাটায় (বার চার্ট)
এই টাস্কে মোটামুটি 20 মিনিট সময় দাও। কমপক্ষে 150 টা শব্দ লেখো।
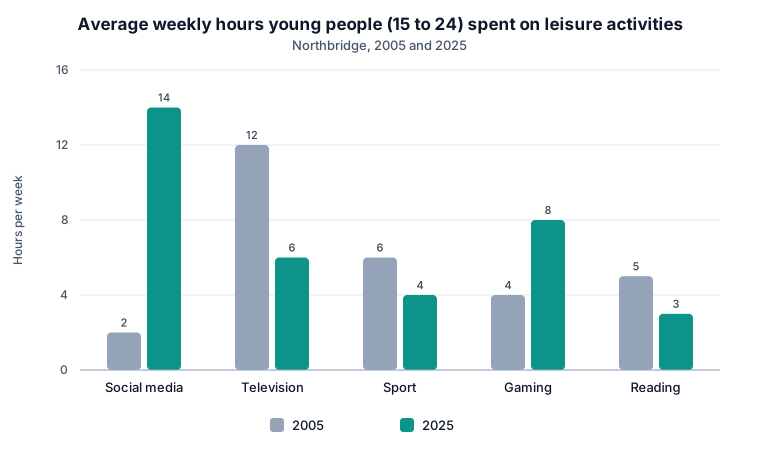
The bar chart below shows the average number of hours per week that young people aged 15 to 24 in Northbridge spent on five leisure activities in 2005 and 2025.
Summarise the information by selecting and reporting the main features, and make comparisons where relevant.
এই প্রশ্নের জন্য শিক্ষকের টিপস
সবচেয়ে বড় পরিবর্তন সোশ্যাল মিডিয়ায়: 2 ঘণ্টা থেকে 14 ঘণ্টা।
যেগুলো বেড়েছে (সোশ্যাল মিডিয়া, গেমিং) সেগুলোর সাথে যেগুলো কমেছে (টিভি, খেলাধুলা, বই পড়া) সেগুলোর তুলনা করো।
গুরুত্বপূর্ণ নম্বরগুলো দাও, কিন্তু দশটা ভ্যালুই লিস্ট করার দরকার নেই।
আরও টাস্ক 1: একাডেমিক রিপোর্ট প্রশ্ন
স্যাল্টমার্শ গ্রামের পরিবর্তন (ম্যাপ)
The maps below show the village of Saltmarsh in 2005 and today. Summarise the information by selecting and reporting the main features, and make comparisons where relevant.
চার শহরে মানুষ কীভাবে অফিসে যায় (টেবিল)
The table below shows the main ways people travelled to work in four cities in 2024. Summarise the information by selecting and reporting the main features, and make comparisons where relevant.
পাট গাছ থেকে কাপড় (প্রসেস)
The diagram below shows how jute fibre is turned into fabric. Summarise the information by selecting and reporting the main features.